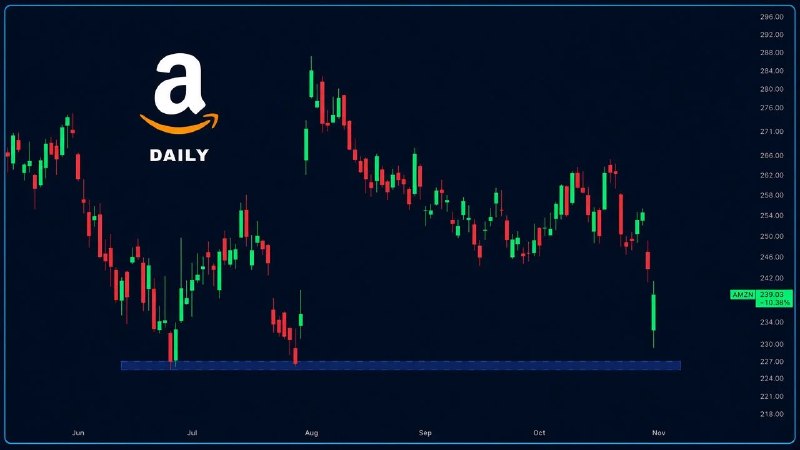

$AMZN daily chart shows price testing the long-term horizontal support zone after a sharp decline. The latest green candle bounced from the blue demand area that has held multiple times this year. A sustained hold above this level keeps the broader structure intact for now.
🌐 链接: https://x.com/FluxCharts/status/2116228650693431459
🏷️ 分组: X|为你推荐
🕒 时间: 2026-10-31 02:00:02
🌐 链接: https://x.com/FluxCharts/status/2116228650693431459
🏷️ 分组: X|为你推荐
🕒 时间: 2026-10-31 02:00:02